IQFROG

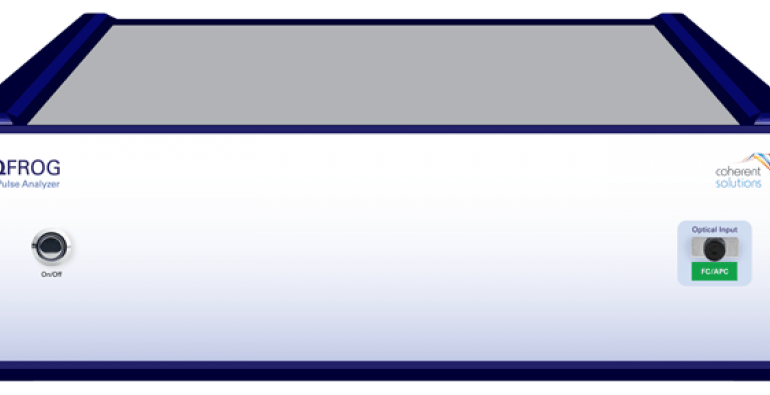
IQFROG measures the intensity and phase of a pulse in both the time and spectral domains, giving a complete pulse characterization. It is equipped with a delay arm and a spectrometer. The system measures pulses up to 50ps wide or down to pulses of 10ps width. IQFROG is available at wavelengths of 1 and 1.5µm.

  • High spectral resolution
  • Long scan time
  • Autocorrelation function
  • Input connector
  • Full software control

The 1µm IQFROG is ideally suited for chirped-pulse-amplification (CPA) seeded laser pulses, and the 1.5µm IQFROG for fiber lasers and picosecond pulses in fiber.

IQFROG 1µm
– Input pulse wavelength range: 1000nm-1100nm
– Intensity and phase measurement for pulses from 300fs to 50ps
– Autocorrelation measurement up to 50ps pulses

IQFROG 1.5µm
– Input pulse wavelength range:1520nm- 1610nm
– Ideal for fiber lasers in the C&L band
– Intensity and phase measurement for pulses from 300fs to 50ps
– Autocorrelation measurement up to 50ps pulses

Features:

-High spectral resolution
The FROG measurement technique requires measuring the second harmonic. The spectral measurement resolution is often limited by the pulse width that the pulse analyzer can measure, while most competing products can measure pulses with a single-pulse duration below 1ps. IQFROG has a built-in high-resolution spectrometer, enabling the measurement of transform-limited pulses of 10ps width or wider, if the pulse has a signal frequency.

-Long scan time
IQFROG uses a long mechanical translation period, which provides a scan range of up to 200ps to enable autocorrelation measurement of pulses up to 50ps long. It is one of the few analyzers on the market that can measure such wide picosecond pulses, as well as short pulses down to 300fs width. The competing SPIDER technique is limited to measuring pulses greater than 1ps.

-Autocorrelation function
IQFROG can scan and record the autocorrelation signal, even when it is too wide (with a very narrow spectral width). IQFROG can be used as an autocorrelator and measures pulses up to 50ps.

-Input connector
The connectorized input makes it easier to couple the beam, eliminating the need for manual alignment. IQFROG is the easiest-to-use optical spectrum analyzer available on the market.

-Full software control
Mechanical control, alignment and tuning via software. No need for manual adjustment.

Applications:
IQFROG is the best choice on the market for:
– Erbium-doped fiber research
– “Seed laser” pulse characterization
– High-speed communication link characterization
– Dispersion compensation optimization
– Optoelectronic component characterization
– Soliton characterization

How does it work?

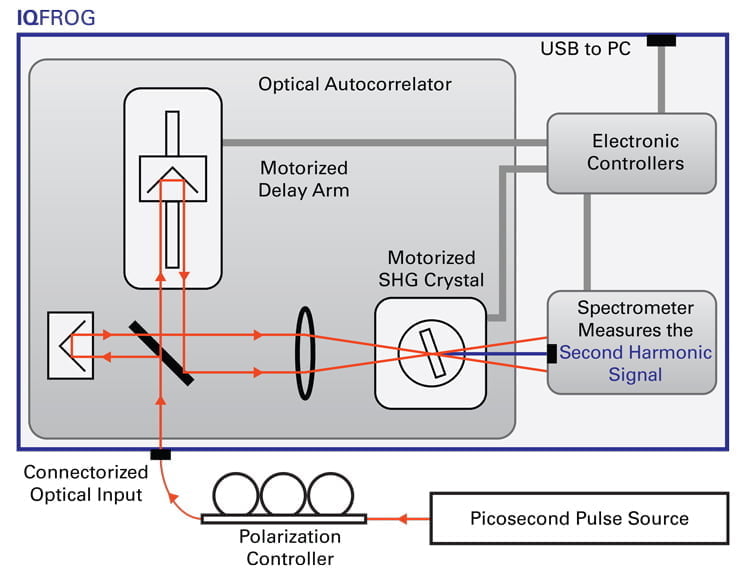
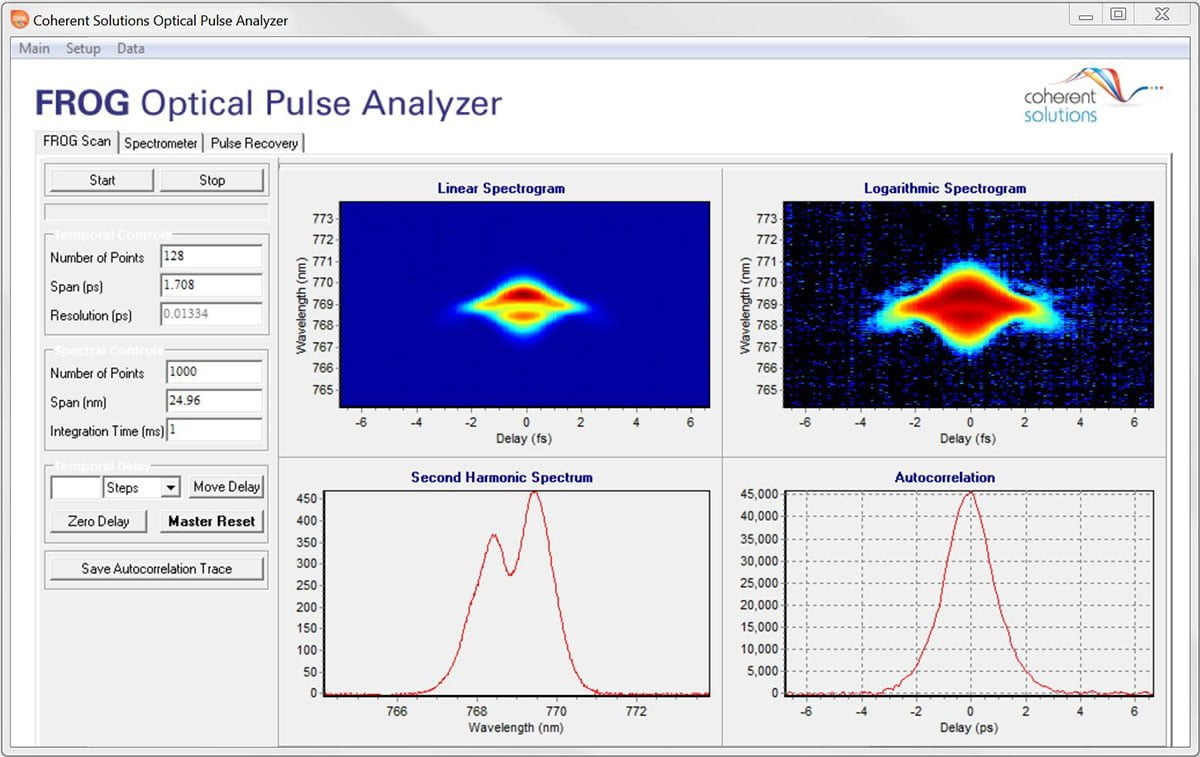
The optical pulse converter is an autocorrelator obtained through second harmonic generation (SHG). This can resolve the measurement of sub-picosecond pulses, because it is not limited by the detector response time. At each delay position on the autocorrelation signal, the full second harmonic spectrum is measured, simultaneously recording the spectral and temporal characteristics of the pulse. The spectrogram is a two-dimensional plot of the second harmonic spectrum as a function of delay. After measuring the spectrum, a fast recovery algorithm is engaged to recover all the pulse characteristics, including shape, spectrum and group delay.

Software interface
IQFROG comes with dedicated software – the Optical Pulse Analyzer (OPA), which controls, measures and records pulses using a user-friendly graphical interface.

Download materials click to expand

???? IQFROG 1 micron

???? IQFROG 1,5 micron

Interested in this product?

Contact us for a detailed quote and technical advice.

Related products

OFDR / HD-FOS - High-Resolution SensingPhotonics & R&DReflectometers (OBR, POF)

Meters & Fusion SplicersOptical Spectrum Analyzers (OSA)OSAPhotonics & R&D

Ask about this product

Product: IQFROG